Profile of the Running ES Score & Positions of GeneSet Members on the Rank Ordered List
| Dataset | Set_04_transDMpreB_versus_DMpreB.phenotype_transDMpreB_versus_DMpreB.cls #transDMpreB_versus_DMpreB.phenotype_transDMpreB_versus_DMpreB.cls #transDMpreB_versus_DMpreB_repos |
| Phenotype | phenotype_transDMpreB_versus_DMpreB.cls#transDMpreB_versus_DMpreB_repos |
| Upregulated in class | transDMpreB |
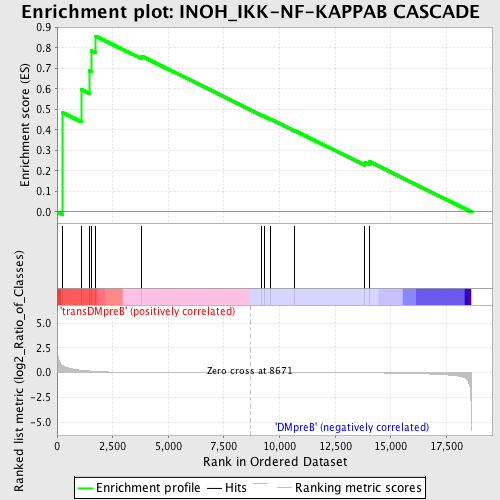
| GeneSet | INOH_IKK-NF-KAPPAB CASCADE |
| Enrichment Score (ES) | 0.85795695 |
| Normalized Enrichment Score (NES) | 1.4806529 |
| Nominal p-value | 0.019027485 |
| FDR q-value | 0.9789707 |
| FWER p-Value | 1.0 |
| PROBE | DESCRIPTION (from dataset) | GENE SYMBOL | GENE_TITLE | RANK IN GENE LIST | RANK METRIC SCORE | RUNNING ES | CORE ENRICHMENT | |
|---|---|---|---|---|---|---|---|---|
| 1 | NFKBIE | 23225 1556 | 226 | 0.751 | 0.4866 | Yes | ||
| 2 | PRKCD | 21897 | 1081 | 0.237 | 0.5979 | Yes | ||
| 3 | NFKBIA | 21065 | 1447 | 0.167 | 0.6891 | Yes | ||
| 4 | RELA | 23783 | 1532 | 0.154 | 0.7869 | Yes | ||
| 5 | PRKCZ | 5260 | 1742 | 0.124 | 0.8580 | Yes | ||
| 6 | NFKBIB | 17906 | 3804 | 0.020 | 0.7607 | No | ||
| 7 | PRKCE | 9575 | 9168 | -0.001 | 0.4731 | No | ||
| 8 | PRKCQ | 2873 2831 | 9311 | -0.001 | 0.4664 | No | ||
| 9 | PRKCI | 9576 | 9604 | -0.002 | 0.4521 | No | ||
| 10 | PRKCH | 21246 | 10681 | -0.005 | 0.3973 | No | ||
| 11 | NFKB1 | 15160 | 13838 | -0.021 | 0.2415 | No | ||
| 12 | PRKCA | 20174 | 14043 | -0.023 | 0.2458 | No |

